Multiple Choice
Identify the
choice that best completes the statement or answers the question.
|
|
|
1.
|
The result of distance divided by time (d/t = ?) is
a. | constant speed | c. | average velocity | b. | variable speed | d. | average speed |
|
|
|
2.
|
Kilometers per hour (km/hour ) represents
a. | constant velocity | c. | average velocity | b. | average speed | d. | constant speed |
|
|
|
3.
|
Which values are necessary to find velocity?
a. | elapsed time, distance, and direction | c. | initial time, ending time,
distance | b. | elapsed time and distance | d. | initial time, direction, and distance |
|
|
|
4.
|
A sprinter finished his 100 meter race in 10 seconds, find his average speed for
the race.
a. | 10 m/s | c. | 100 m/s | b. | 0.10 m/s | d. | 1000 m/s |
|
|
|
5.
|
A truck travels 90 km/hr in a northwest direction, the variables will describe
the truck’s
a. | average velocity | c. | average speed | b. | acceleration | d. | deceleration |
|
|
|
6.
|
Given: distance = 20 meters, time = 2 seconds. Find average speed.
a. | 2 m/s | c. | 40 m/s | b. | 10 m/s | d. | 0.1 m/s |
|
|
|
7.
|
Given: distance = 100 meters, average speed = 20 m/s. Find time.
a. | 200 seconds | c. | 100 seconds | b. | 20 seconds | d. | 5 seconds |
|
|
|
8.
|
Given: time = 30 seconds, 10 meters/second. Find distance.
a. | 10 meters | c. | 0.3 meters | b. | 300 meters | d. | 30 meters |
|
|
|
9.
|
A rubber ball is dropped from rest from a height of 10 meters above the
ground. The rubber ball free falls and reaches the ground 2 seconds later. What was the
average speed of the rubber ball?
a. | 20 m/s | c. | 0.2 m/s | b. | 5 m/s | d. | 10 m/s |
|
|
|
10.
|
An athlete can run 20 kilometers in 2 hours. If the athlete runs at that
same average speed for 1 hour, how far will the athlete run.
a. | 10 km | c. | 5 km | b. | 20 km | d. | 40 km |
|
|
|
11.
|
Which of the following represents the velocity of a moving car?
a. | 50 m/s, in a southern direction | c. | 50 m, in a southern
direction | b. | 50 m/s | d. | 50 |
|
|
|
12.
|
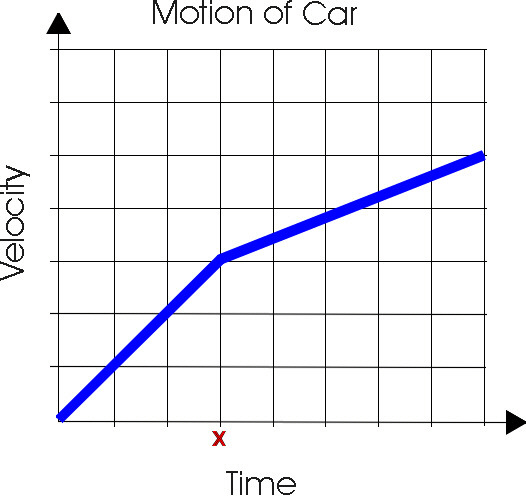 A pizza delivery driver applied a constant force to
a car. A graph of the car’s movement is shown above. Which of the following can
best explain the change in velocity at time X? a. | The car’s momentum became greater than its inertia | c. | The car began
traveling up a hill | b. | The car began to drive on a curved
road | d. | The car changed from a
rough road to a smooth road with less friction |
|
|
|
13.
|
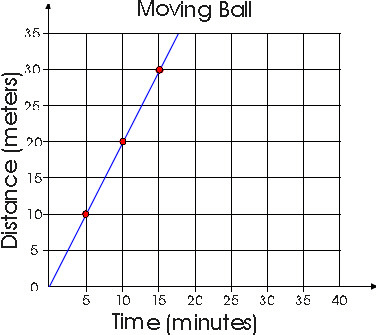 The graph above shows the movement of a ball at
several points in time. What is the average speed of the object? a. | 0.5 m/min | c. | 4 m/min | b. | 2 m/min | d. | 50 m/min |
|
|
|
14.
|
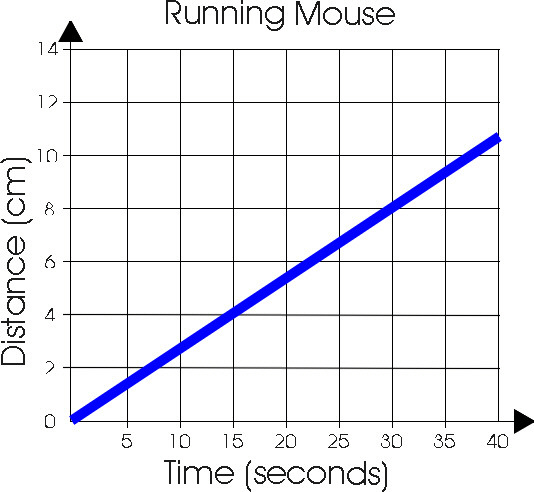 The graph above shows the distance traveled by a
mouse in a straight line. If the mouse keeps moving at the same speed in a straight line, how
far will the mouse travel in 30 seconds a. | 8 cm | c. | 10.0 cm | b. | 12.0 cm | d. | 11.0 cm |
|
|
|
15.
|
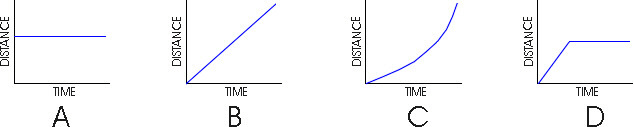 Which distance-time graph above shows that an
object moved at a constant speed and then stopped moving?
|