Multiple Choice
Identify the choice that best completes the
statement or answers the question.
|
|
|
1.
|
Which number sentence will correctly solve this problem?
The children ate 8
slices of a pizza. The pizza was cut into 12 slices.
How many slices were left?
a. | 12 – 8 = 4 | d. | 20 – 8 = 12 | b. | 8 + 12 = 20 | e. | 20 – 4 = 16 | c. | 8 + 4 =
12 |
|
|
|
2.
|
Two brothers can share the money from selling the apples picked from
their
grandmother’s apple tree. They pick 100 pounds of apples and sell
them for $.50 a pound. How
much money will each brother get?
a. | $10.00 | d. | $100.00 | b. | $25.00 | e. | $5.00 | c. | $50.00 |
|
|
|
3.
|
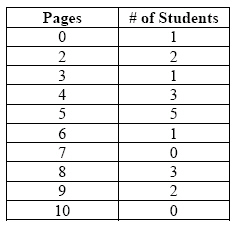 The table shows the number of pages students read during
silent reading time. How many students read 5 or more pages?
|
|
|
4.
|
Which ratio represents the number of circles to squares? 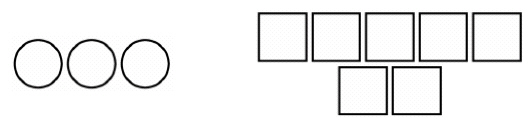
|
|
|
5.
|
Trea has 5 sisters. They have all been asked to help their
Grandmother. Their
Grandmother has a list of 12 things she needs the girls to
do. If each girl does her equal share,
how many tasks will each girl do?
|
|
|
6.
|
Statistics/Probability and Graphing –
Graphing – RIT 181 – 190
Mrs. Smith’s class did a survey to
see which was the favorite color of bicycles for third grade students. Read the graph
below. 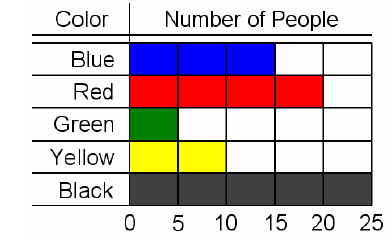 Which color was the favorite?
a. | Red | d. | Blue | b. | Yellow | e. | Green | c. | Black |
|
|
|
7.
|
Statistics/Probability and Graphing –
Probability – RIT 181 – 190
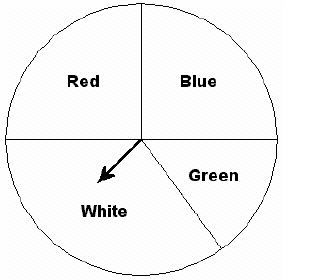 What is the probability
of the spinner stopping on yellow?
a. | possible | d. | impossible | b. | likely | e. | unlikely | c. | certain |
|
|
|
8.
|
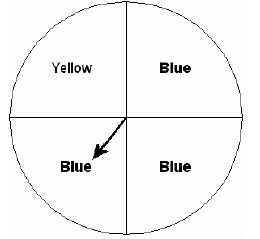 What is the probability of the spinner stopping on
blue? a. | 1 to 3 | d. | 3 to 4 | b. | 5 to 2 | e. | 3 to 1 | c. | 1 to
2 |
|
|
|
9.
|
Statistics/Probability and Graphing –
Combinations & Permutations – RIT191 – 200
In how many different
ways can the letters in the word MATH be
arranged?
|
|
|
10.
|
Statistics/Probability and Graphing –
Graphing – RIT 191 – 200
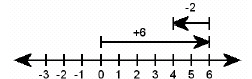 What subtraction sentence is modeled
on the number line shown above?
a. | 3 + 6 = 9 | d. | 6 – 4 = 2 | b. | 6 – 2 = 4 | e. | 4 – 2 = 2 | c. | 2 + 6 =
8 |
|
|
|
11.
|
|
|
|
12.
|
Look at the graph. It represents the number of milkshakes ordered
at “Shakeland” in a three hour period. 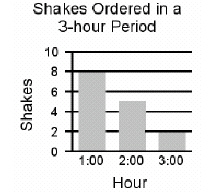 What is the average
number of shakes ordered per hour?
|
|
|
13.
|
The line graph shows the number of students that were absent from a
third grade class in one week. 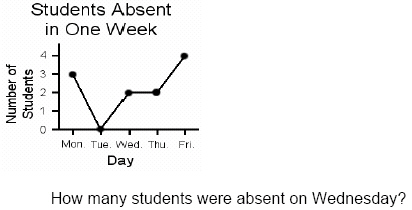
|
|
|
14.
|
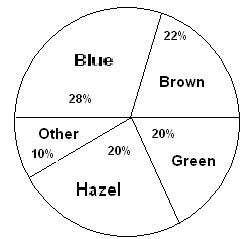 What is the most common eye color? a. | blue | d. | hazel | b. | brown | e. | other | c. | green |
|
|
|
15.
|
a. | Monday | d. | Thursday | b. | Tuesday | e. | Friday | c. | Wednesday |
|
|
|
16.
|
Statistics/Probability and Graphing – Probability and Prediction
– RIT 191 –200
Without looking, you pull out only one M&M from a bag that
contains 5 red, 10
green, 5 yellow, 5 orange, and 5 blue M&M’s. What color are you
most
likely to pull out?
a. | red | d. | orange | b. | green | e. | blue | c. | yellow |
|
|
|
17.
|
Statistics/Probability and Graphing – Statistics – RIT 191
– 200
In a survey of 30 seventh graders' favorite colors, 5 chose red, 10 chose
blue,
7 chose green, and 8 chose yellow. What is the correct tally entry for green?
|
|
|
18.
|
Bill received the following scores on 5 tests: 90, 90, 80, 70, 70. What was
his
average test score?
|